Comparison Overview
Available in: All plans
Last updated: 26-Feb-2026
Overview
The Comparison tab lets you compare a Current schedule against a Baseline schedule to see exactly what changed between two versions. Kazinex identifies added activities, deleted activities, and field-level modifications — then categorizes each change by impact and severity so you can focus on what matters most.
This is essential for period-over-period reporting, variance analysis, and demonstrating compliance with project controls standards.
Selecting Schedules
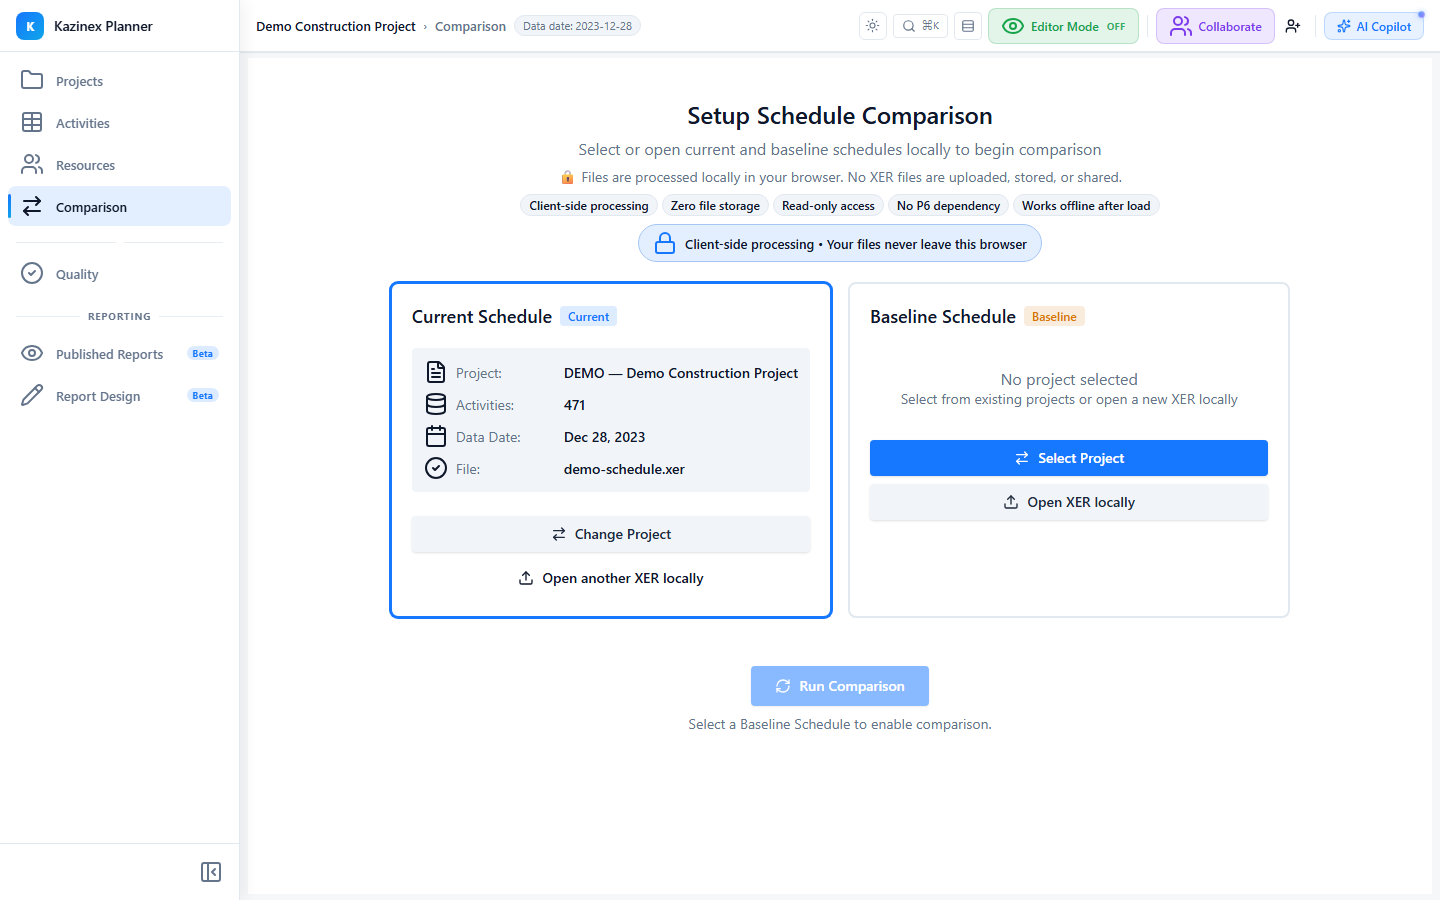
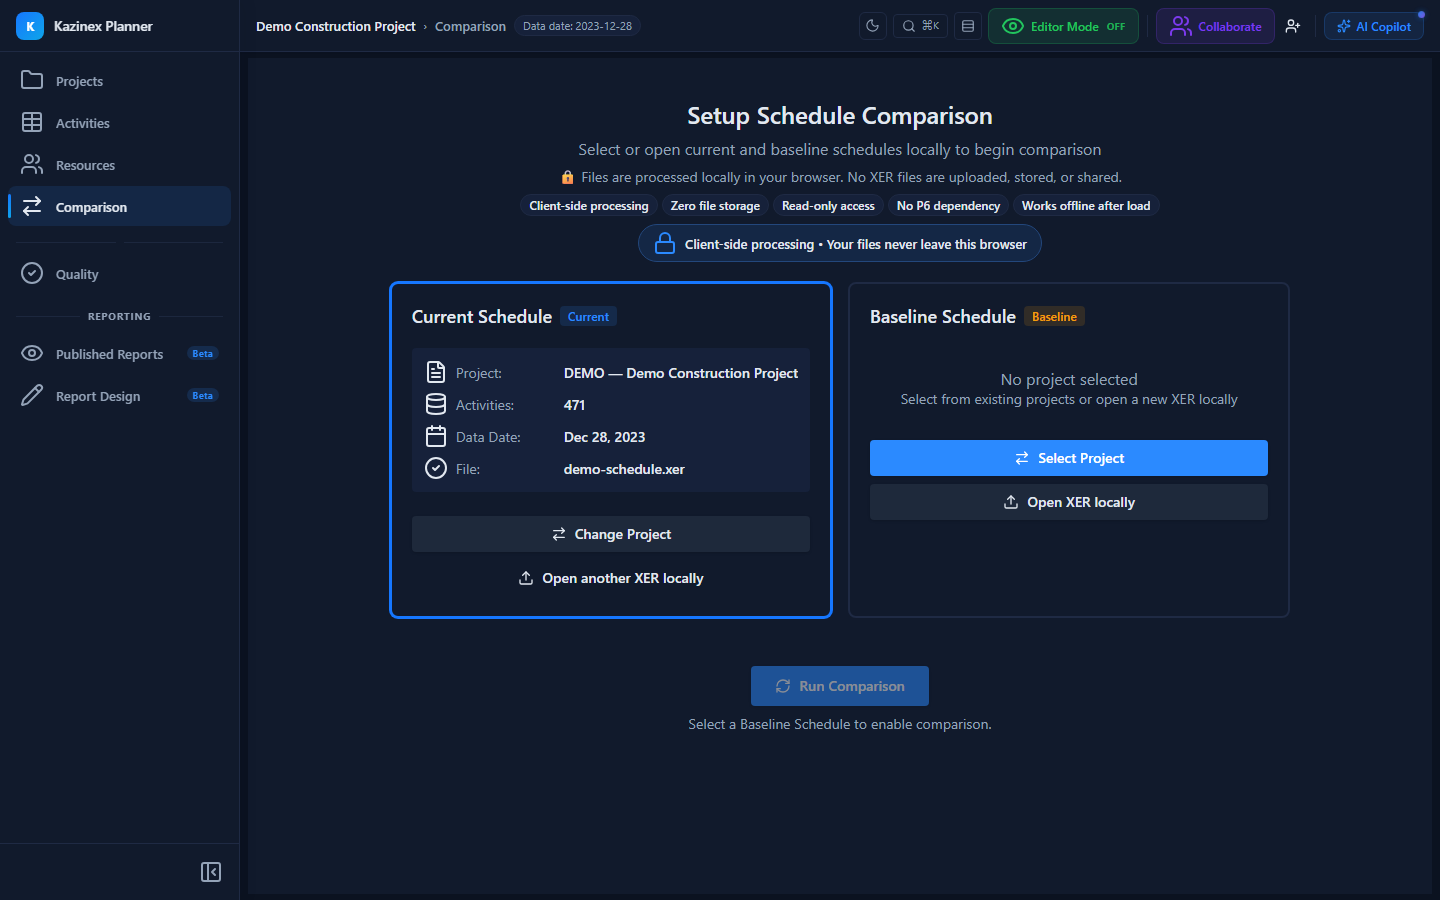
The Comparison tab starts with a project selector showing two cards side by side:
| Card | Colour | Purpose |
|---|---|---|
| Current | Blue | The latest version of your schedule |
| Baseline | Orange | The reference version to compare against |
Each card shows the project name, data date, activity count, and file name. You can:
- Select from loaded projects — Choose from any schedule already uploaded in your account.
- Upload a new file — Drag and drop an XER or MPP file directly onto either card.
- Swap — Click the swap button (⇄) to reverse which schedule is Current and which is Baseline.
See Selecting Schedules for detailed instructions.
Comparison Levels
Once both schedules are selected, Kazinex runs the comparison engine and presents results as change-type cards grouped under three severity tiers (see Change Categorization below), rather than separate tabs. Within a tier, each card covers one type of change — including, among others:
| Card | What It Compares |
|---|---|
| Original Duration | Original duration modified by user |
| WBS Assignment | Activity reassigned to a different WBS node |
| ID/Description Changes | Activity code or name modified |
| Relationship + Lag | Predecessor/successor/lag additions, removals, and modifications |
| Resource Assignment | Labour, equipment, and material resource changes — see Resource Comparison |
| Activity Code Changes | Activity code type, value, and assignment differences |
| Constraint Changes, Activity Settings, UDF Changes, New/Deleted Activities, Calendar Definition Changes | Additional change types, one card each |
Each card shows a numbered count badge for how many changes it contains. Click a card to open a full-screen drill-down with the affected activities — see Activity Changes.
Change Categorization
Every change is classified into one of three tiers based on how it occurred:
| Tier | Colour | Meaning | Examples |
|---|---|---|---|
| Hard | Red | Direct user modifications — someone changed this intentionally | Constraints, resources, relationships, activity codes, WBS, calendar, ID/description changes |
| Medium | Yellow | Indirect user updates — progress and actuals entry | Actual dates, percent complete, status, remaining duration, remaining work |
| Soft | Blue | Calculated/derived values — changed as a consequence of other edits | Early/late dates, float values, critical/driving path flags, at-completion metrics |
This categorization helps you distinguish between deliberate scope changes (Hard), routine progress updates (Medium), and schedule engine recalculations (Soft).
Change Badges
Each modified activity displays coloured badges indicating what types of changes were detected:
| Badge | Category |
|---|---|
| Duration | Original or remaining duration changed |
| Resource | Resource assignment added, removed, or modified |
| Constraint | Constraint type or date changed |
| Relationship | Predecessor or successor relationship changed |
| WBS | Activity moved to a different WBS element |
| Activity Code | Activity code assignment changed |
| UDF | User-defined field value changed |
| Calendar | Calendar assignment or definition changed |
| Progress | Percent complete updated |
| Status | Activity status changed (Not Started → Active → Complete) |
| Dates | Start or finish date changed |
| Float | Total float, free float, or critical path flag changed |
Click any badge to open the Change Drawer with detailed before/after values for that change category.
Change Severity
Each change also receives a severity score (0–100) based on its impact:
| Severity | Score | Colour |
|---|---|---|
| Critical | 80–100 | Red |
| High | 60–79 | Orange |
| Medium | 40–59 | Yellow |
| Low | 20–39 | Light Blue |
| Info | 0–19 | Grey |
Colour Coding
Changes are colour-coded by category for quick visual scanning:
| Category | Colour |
|---|---|
| Date Changes | Blue |
| Duration Changes | Purple |
| Float Changes | Orange |
| Status Changes | Green |
| Relationship Changes | Dark Blue |
| Resource Changes | Dark Green |
| Cost Changes | Bright Green |
| WBS Changes | Purple |
| Activity Code Changes | Teal |
| Constraint Changes | Red |
| New Activities | Green |
| Deleted Activities | Red |
The Comparison Results View
The main results area includes:
Summary Cards
At the top, three summary cards show:
- Activity Coverage — Total activities and how many have changes (plus the overall Change Rate)
- Schedule Movement — Newly started and newly finished activity counts (plus average remaining-duration delta)
- Scope Volatility — Activities added and removed (plus net scope change)
Change-Type Cards
Below the summary, changes are grouped into Critical (Hard), Medium, and Soft (Calculated) tiers (see Change Categorization); each tier expands to show its change-type cards (Original Duration, WBS Assignment, Relationship + Lag, Resource Assignment, and others — see Comparison Levels) with a count badge per card.
Drill-Down View
Click any change-type card to open a full-screen view for that change type, with:
- Options and a search bar (search by activity code, field, or description)
- Field-type filter chips specific to that change type (e.g. Relationship Added / Deleted / Modified, Lag Modified)
- A Group by Activity toggle
- A table: Activity ID, Activity Name, Old Value, New Value, Delta, Remarks
The Resource Assignment drill-down additionally offers Units/Cost view toggles, a resource filter, and a Hide Zero Values option — see Resource Comparison.
Next Steps
- Selecting Schedules — How to choose schedules for comparison
- Quality Overview — Run quality checks on your schedule
- Activities Grid — Browse activities in the data grid