Markers & Sight Lines
Available in: All plans
Last updated: 05-Mar-2026
Overview
Markers are vertical lines drawn on the Gantt chart to highlight important dates. Kazinex supports three types of markers: the data date line, up to three custom sight lines, and progress lines. Each marker is independently configurable for colour, width, style, and label.
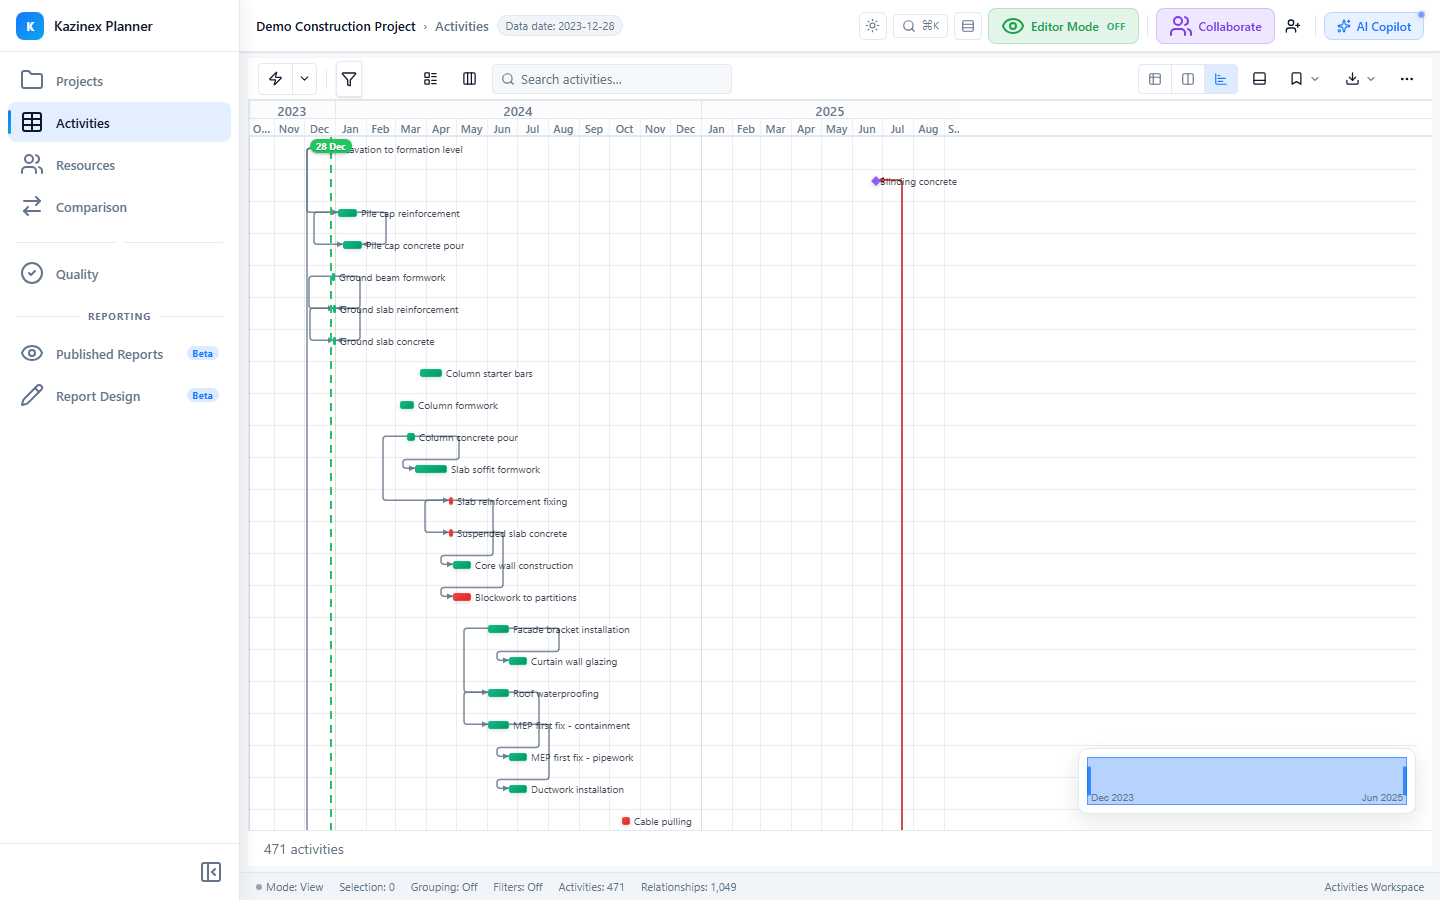
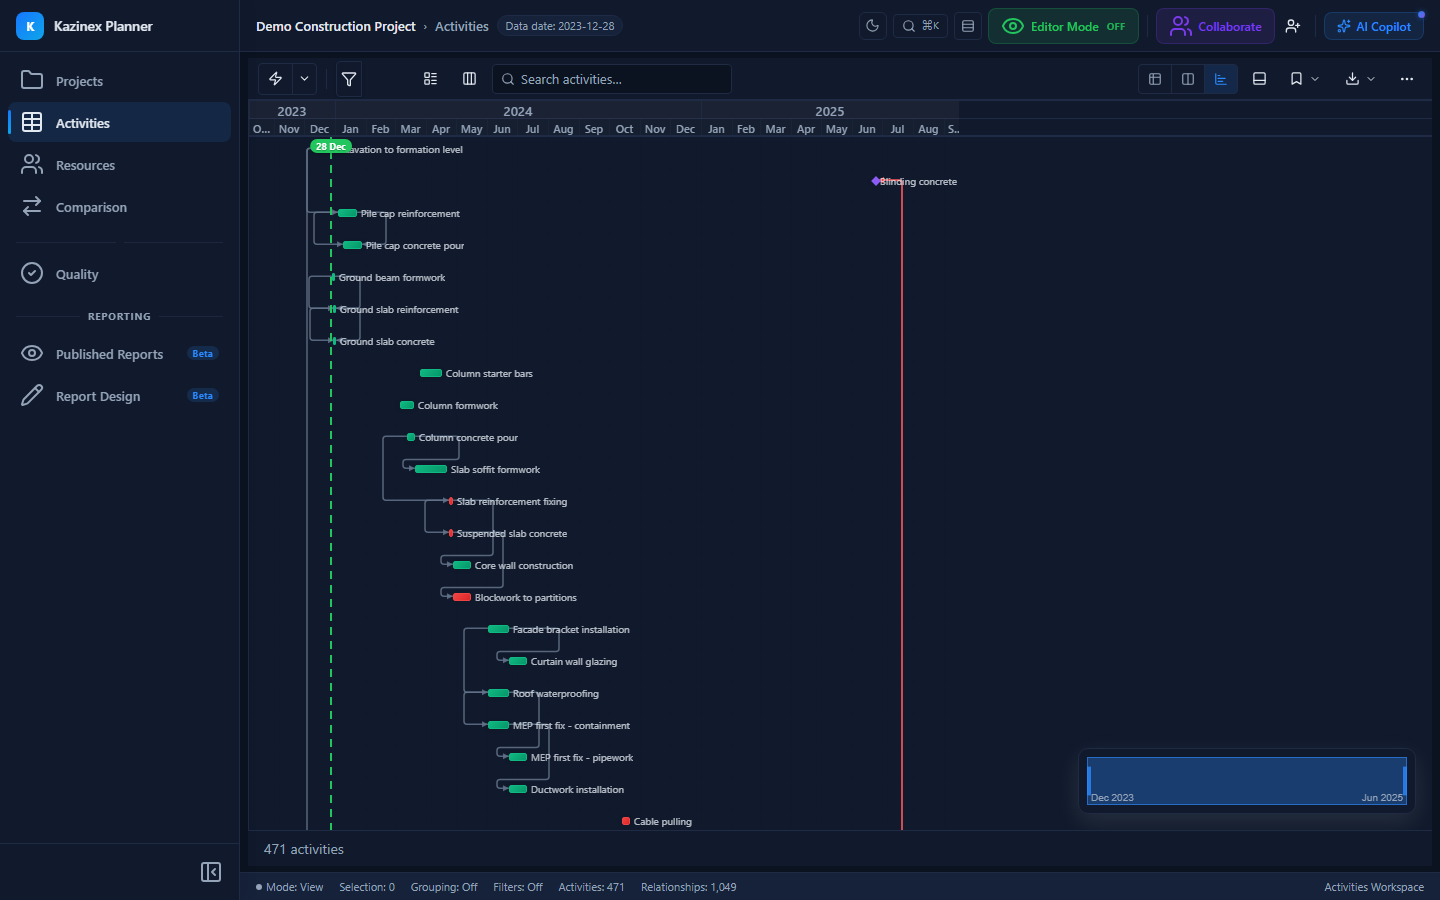
Data Date Line
The data date line marks the schedule's data date — the as-of date that separates actual progress from forecast. It is the most important reference line on any schedule.
Default Appearance
| Property | Default Value |
|---|---|
| Colour | Green (#22C55E) |
| Width | 2 px |
| Style | Dashed |
| Label | Shown (data date value) |
| Label font size | 10 px |
Configuration
- Open Gantt Settings → Chart Options → Data Date.
- Toggle Show to display or hide the line.
- Adjust colour, width, and line style.
- Toggle Show Label to display the date above the line.
Sight Lines
Sight lines are custom marker lines you position at any date. Kazinex supports up to three independent sight lines, matching the P6 convention.
Configuration Per Sight Line
| Property | Options |
|---|---|
| Enabled | On / Off |
| Date Source | Custom date, Project Start, Project Finish, or Data Date |
| Custom Date | Any date (available when date source is "Custom") |
| Colour | Any CSS colour |
| Width | 1–5 px |
| Style | Solid, Dashed, or Dotted |
| Label | Custom text label displayed above the line |
Step-by-Step Guide
Step 1 — Open Sight Lines Settings
Click Gantt Settings → Chart Options → Sight Lines.
Step 2 — Enable a Sight Line
Toggle Line 1 (or Line 2, Line 3) to "Enabled".
Step 3 — Choose a Date Source
Select one of:
- Custom — Enter a specific date
- Project Start — Automatically set to the project's earliest date
- Project Finish — Automatically set to the project's latest date
- Data Date — Mirrors the data date line (useful for a different colour/style)
Step 4 — Customise Appearance
Set the colour, width, line style, and label text.
Common Use Cases
| Sight Line | Purpose |
|---|---|
| Contractual Milestone | Mark a key delivery date with a red dashed line |
| Reporting Period End | Mark the end of the current reporting period |
| Previous Data Date | Show the previous update's data date for comparison |
Progress Lines
Progress lines connect the data date to each activity's actual progress point, creating a zigzag pattern that shows where work is ahead or behind schedule.
| Property | Default Value |
|---|---|
| Show | Off |
| On-track colour | Green (#22C55E) |
| Behind-schedule colour | Red (#EF4444) |
| Width | 2 px |
| Show dates | Off |
When enabled, activities that are ahead of schedule show a green line bending to the right, and activities that are behind schedule show a red line bending to the left.
Display Options
Additional chart display options that affect the background:
| Option | Default | Description |
|---|---|---|
| Weekend Shading | On | Light grey bands on Saturdays and Sundays |
| Holiday Shading | Off | Light red bands on calendar holidays |
| Non-Work Shading | Off | Light grey bands for non-work periods |
| Column Grid Lines | On | Vertical lines at timescale intervals |
| Row Grid Lines | On | Horizontal lines separating activity rows |
Tips & Best Practices
- Keep the data date line visible at all times — it is the most important visual anchor on the chart
- Use sight lines to mark contractual milestones during progress meetings
- Enable progress lines when presenting schedule status to stakeholders
Troubleshooting
| Problem | Cause | Solution |
|---|---|---|
| Data date line not visible | Disabled in chart options | Open Gantt Settings → Chart Options → Data Date → Show: On |
| Sight line missing | Date is outside the current viewport | Scroll or zoom to include the sight line date |
| Progress lines look wrong | Data date not set correctly | Verify the data date in the project properties |