Compare Two Schedule Periods
Time: ~12 minutes Level: Intermediate Applies to: Free · Pro · Enterprise
What You Will Learn
By the end of this tutorial, you will be able to:
- Run a comparison between baseline and current schedules
- Read the Change Summary dashboard
- Drill into modified activities to see field-level changes
- View changes rolled up by WBS level
- View changes by activity code
- Understand comparison badges (Added, Deleted, Modified)
Prerequisites
- A Kazinex account (any tier)
- A baseline and current schedule marked (see Upload and Mark a Baseline)
Step 1 — Open the Comparison Tab
Navigate to the comparison view.
- Open your Current schedule from the Projects tab.
- Click the Comparison tab in the main navigation.
- If a comparison has already been run, results appear immediately. Otherwise, continue to Step 2.
What you should see: The Comparison tab either shows existing results or a prompt to run a new comparison.
Step 2 — Run the Comparison
Trigger the comparison engine to analyse the two schedules.
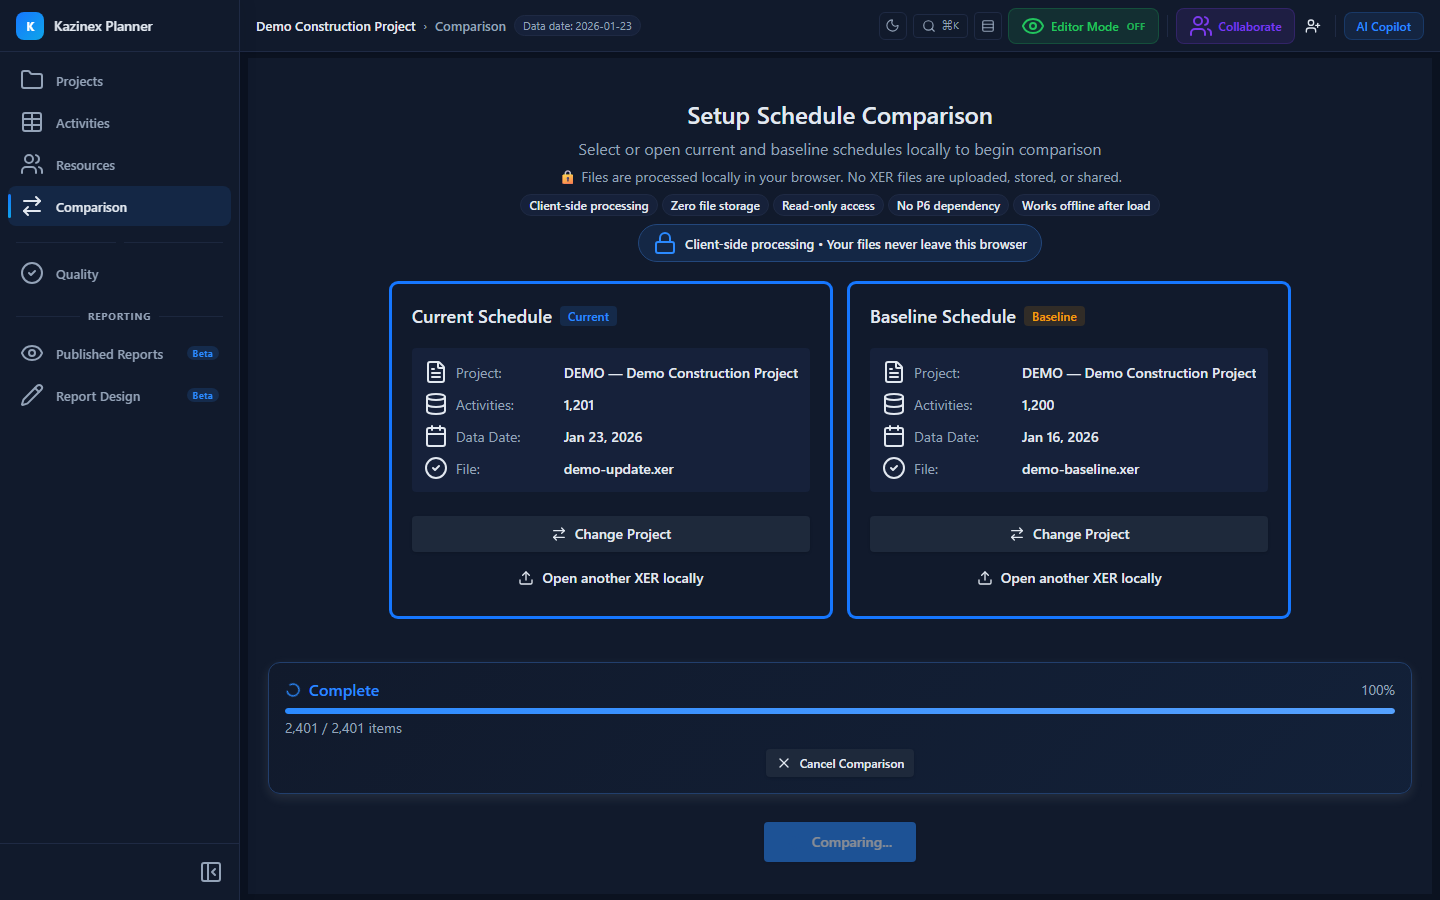
- If results are not already displayed, click Run Comparison.
- The system compares the current schedule against the marked baseline.
- Wait for the progress bar to complete.
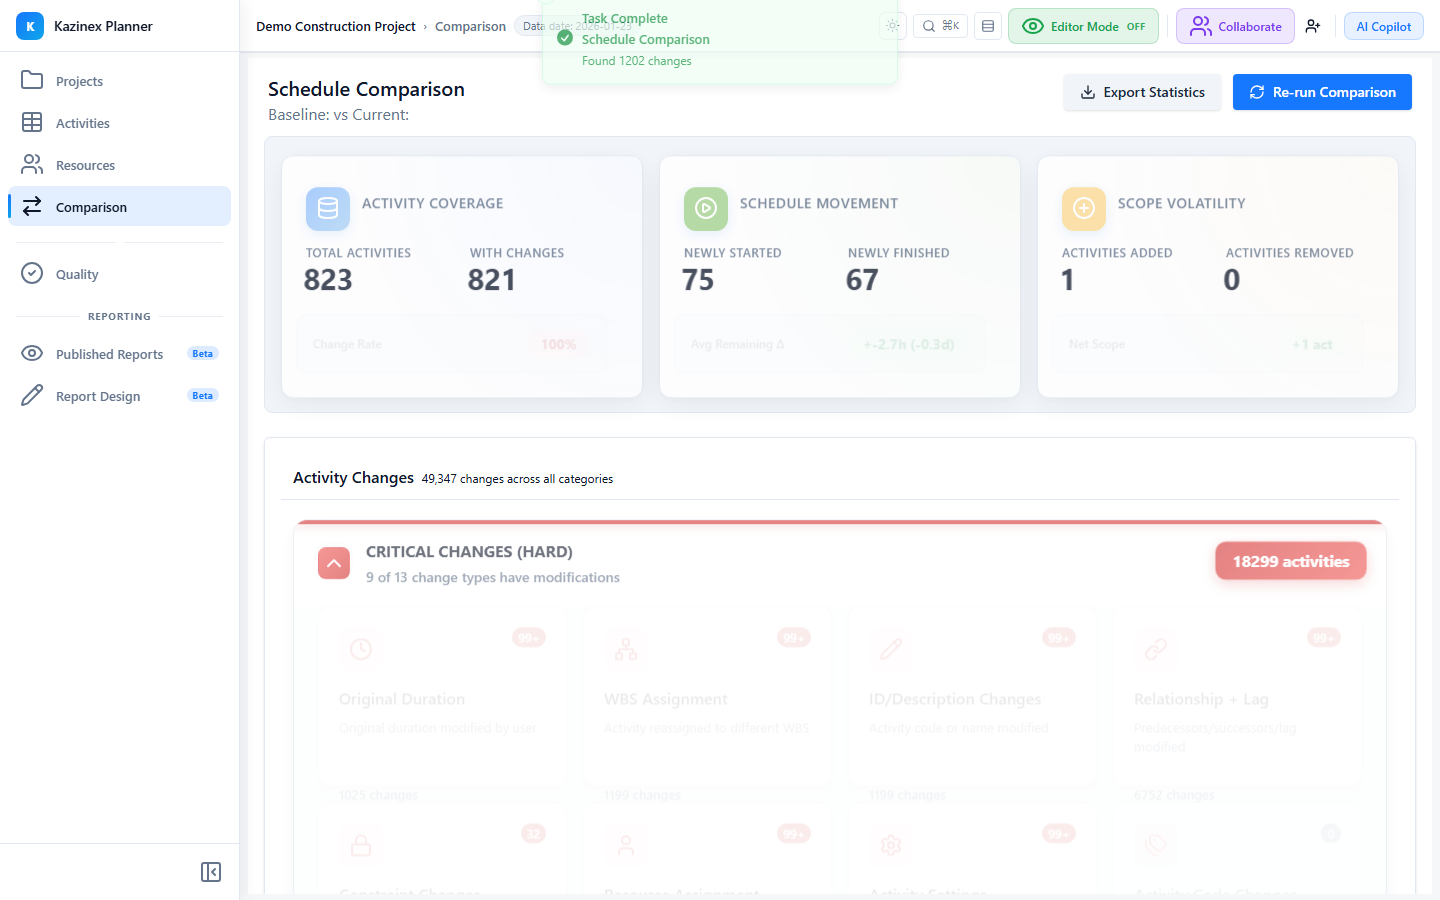
What you should see: A loading overlay while the engine processes. Once complete, the Change Summary dashboard appears.
Step 3 — Review the Change Summary
The dashboard gives you a high-level picture of all changes.
- Read the Total Changes card — this shows the aggregate count of all added, deleted, and modified activities.
- Read the Cost Delta card — the net change in total cost between baseline and current.
- Read the Labour card — the change in labour resource hours.
- Read the Material card — the change in material quantities.
- Read the Non-Labour card — the change in non-labour resources.
What you should see: Five summary cards, each displaying a count or monetary/unit value. Positive deltas appear in green; negative deltas appear in red.
Step 4 — Drill Into Modified Activities
See exactly which fields changed for each modified activity.
- Click the Modified count on the summary card (or switch to the Activity-level view).
- A table lists all modified activities with their Activity IDs and names.
- Click on any activity row to expand it.
- The expanded view shows field-level changes: each changed field displays the old value and the new value side by side.
What you should see: For example, an activity might show "Original Duration: 10d → 15d" and "Early Finish: 15-Aug → 22-Aug". Each changed value is highlighted.
Step 5 — Review Added and Deleted Activities
Check which activities are new or removed.
- Click the Added count on the summary card.
- A list shows activities that exist in the current schedule but not in the baseline.
- Click the Deleted count.
- A list shows activities that existed in the baseline but are missing from the current schedule.
What you should see: Separate lists for added and deleted activities. Added rows appear with green badges; deleted rows appear with red badges.
Step 6 — View WBS Rollup
See changes aggregated by WBS level for a structural overview.
- Switch to the WBS Rollup view using the tab or toggle at the top of the comparison grid.
- Each WBS node shows the count of changes within it.
- Expand a WBS node to see child nodes and their change counts.
- Drill down to the leaf level to see individual activities.
What you should see: A hierarchical tree where each WBS node displays an aggregate count of added, deleted, and modified activities beneath it.
Step 7 — View Activity Code Comparison
See changes grouped by activity code type.
- Switch to the Activity Code view.
- Select an activity code type (for example, "Phase") from the dropdown.
- Changes are grouped by code value (for example, "Design", "Construction", "Commissioning").
What you should see: Each activity code value shows the count of changes. This helps you understand which project phases had the most movement.
Step 8 — Understand Comparison Badges
Badges provide at-a-glance status for each activity.
- Notice the coloured badges on each row:
- Green — Added (new activity in the current schedule)
- Red — Deleted (activity removed since the baseline)
- Amber — Modified (activity exists in both but has changed)
- Badges appear in all comparison views: activity list, WBS rollup, and activity code views.
What you should see: A consistent colour scheme across all views that lets you scan quickly for the type and severity of changes.
Step 9 — Get an AI Narrative Summary (Optional)
Use the AI Copilot to generate a written summary of the changes.
- Open the AI Copilot panel (Ctrl+Shift+I).
- Type: "What changed from baseline?"
- The Copilot runs the comparison and generates a natural language summary.
- Review the narrative for key findings: largest delays, added scope, deleted activities.
What you should see: A professional narrative paragraph describing the most significant changes between the baseline and current schedules.
Step 10 — Verify Your Work
Confirm you can navigate all comparison views.
- The Change Summary dashboard shows accurate counts.
- Modified activities expand to show field-level old → new values.
- The WBS Rollup aggregates changes correctly.
- The Activity Code view groups changes by code type.
- Badges appear consistently across all views.
What you should see: A comprehensive understanding of what changed between two schedule periods, viewable at summary, activity, WBS, and activity code levels.
What's Next?
- Achieve a 90+ Quality Score — check the quality of your current schedule
- AI Copilot — Baseline Variance Analysis — use the AI to analyse baseline drift and generate reports
- Comparison Overview — full reference documentation
Troubleshooting
| Issue | Solution |
|---|---|
| Run Comparison button is disabled | Ensure both a Baseline and Current schedule are marked in the Projects tab. |
| Comparison shows zero changes | The two schedules may be identical. Verify you uploaded different schedule periods. |
| WBS Rollup tree is empty | The WBS structures must be compatible. If one schedule has a completely different WBS, the rollup may not match. |
| Activity Code view shows no data | Ensure the schedules contain activity codes. If codes were not included in the import, this view will be empty. |
| Field-level changes not expanding | Click directly on the activity row or the expand icon. Some browsers may require a double-click. |